Introducing the Excel Insight Flywheel

SUMMARY: The Excel Insight Flywheel uses an all-Excel strategy to create a self-reinforcing cycle that relies on learning curves and experience curves to improve Excel work over time. Momentum compounds as teams standardize workflows, reducing manual effort and errors. Over time—and with help from ChatGPT and Copilot—organizations become smarter, faster, and more innovative—transforming Excel from destructive drudgery to ultra-productivity. Here’s an introduction to the new strategy.
You’d think doing something over and over would make you faster at it.
That’s because, according to the theory of the learning curve, the more often we repeat a task, the better and faster we should become.
But not in Excel. For most users, the time it takes to complete an Excel task doesn’t improve much over time. Reports aren’t built faster or better. Neither are analyses, forecasts, or models. And mistakes don’t disappear. At least, not by much.
That low ceiling for Excel productivity is a significant problem for companies. That’s because it places a strict limit on the number of accurate reports their Excel teams can generate each month—no matter how many hours of overtime they work.
This isn’t caused by flaws in Excel or its users. It’s a universal failure caused by the Excel reporting strategy that most companies use: the Excel Scutwork Strategy.
Why Excel Learning-Curves Fail
The reason we normally expect to improve our productivity when we do something over and over is rooted in the theory of learning curves.
Learning curves rely on consistent repetition of a structured task to improve efficiency—as we see in manufacturing assembly lines, for example. But typically, Excel work is unstructured—as dictated by the widely used Excel ad hoc reporting strategy.
With that strategy, every individual report, forecast, dashboard, or whatever tends to have its own logic. Data is cleaned in different ways. Workbook settings are stored in different places. Formulas follow inconsistent patterns.
Excel Users Are Stuck in Ad Hoc Excel Work
When we use an ad hoc design strategy, the expected benefits of our learning curve fail to appear, for at least three reasons:
1. Lack of Pattern Recognition. Learning curves work because repetition helps the brain recognize patterns and optimize actions. If the task keeps changing, the brain doesn’t get a chance to refine a single approach.
2. No Muscle Memory or Automation. In physical or cognitive tasks, repetition builds muscle memory and automatic responses. If the process varies, we must consciously think through each step, slowing our progress.
3. Inconsistent Feedback Loops. Learning improves when people receive feedback and adjust their approach. But if the task changes frequently, it’s harder to identify what works and what doesn’t.
In short, performing many ad hoc tasks is like performing many different tasks. And so, we gain no learning-curve benefits.
But the problem gets even worse for organizations.
Why Excel Experience Curves Fail
Experience curves rely on a similar idea as learning curves. But they apply to organizations, not people.
Under the experience curve, costs fall because the system gets better. That’s because organizations document what works, reuse what they build, and improve the process over time.
It’s what made companies like Amazon, Toyota, and Nvidia more efficient with each new unit they sold. Not just smarter people—smarter systems.
That’s the additional cost-saving curve that Excel teams need. But most teams never get there.
The Strategic Fix: The EDP Strategy
Originally, I designed the Excel Data Plumbing (EDP) Strategy to slash the time spent on manual Excel reporting.
Instead of building each new instance of Excel work from scratch, Excel Data Plumbers start with a specially structured workbook known as a flowbook. In flowbooks, data is managed consistently. Settings are stored in predictable places. Interactivity uses a consistent design.
All reflows—automated analyses, reports, forecasts, etc.—can be refreshed with one command in each flowbook. No add-in or VBA is needed.
One day, I realized something else about my EDP Strategy. I realized that by turning all Excel reports, analyses, forecasts and such into reflows, I had transformed them all into one easily repeatable type of task.
That is, I had found a hidden door that led to the benefit of learning and experience curves for Excel. And therefore, for the first time ever, my Excel work could gain from three independent founts of Excel productivity.
And then I realized that we could group those three productive forces into one unifying concept…
Introducing the Insight Flywheel
As teams implement the Brainwork Strategy, they fuel a self-reinforcing cycle that resembles a flywheel, which is used in engineering. It’s illustrated by the following image with these six steps:
A. Identify new, high-value information needs
Focus on the under-served insights that currently matter most to managers.
B. Discover answers using flowbook analysis
Using data from any number of internal and external sources, nearly any kind of data transformation and visualization, and brainstorming help from ChatGPT and Copilot, to find the answers that management needs.
C. Deliver answers each period using flowbook reporting
Enable quick decisions with responsive, easily updatable insight with visualizations and data storytelling—with even more help from AI.
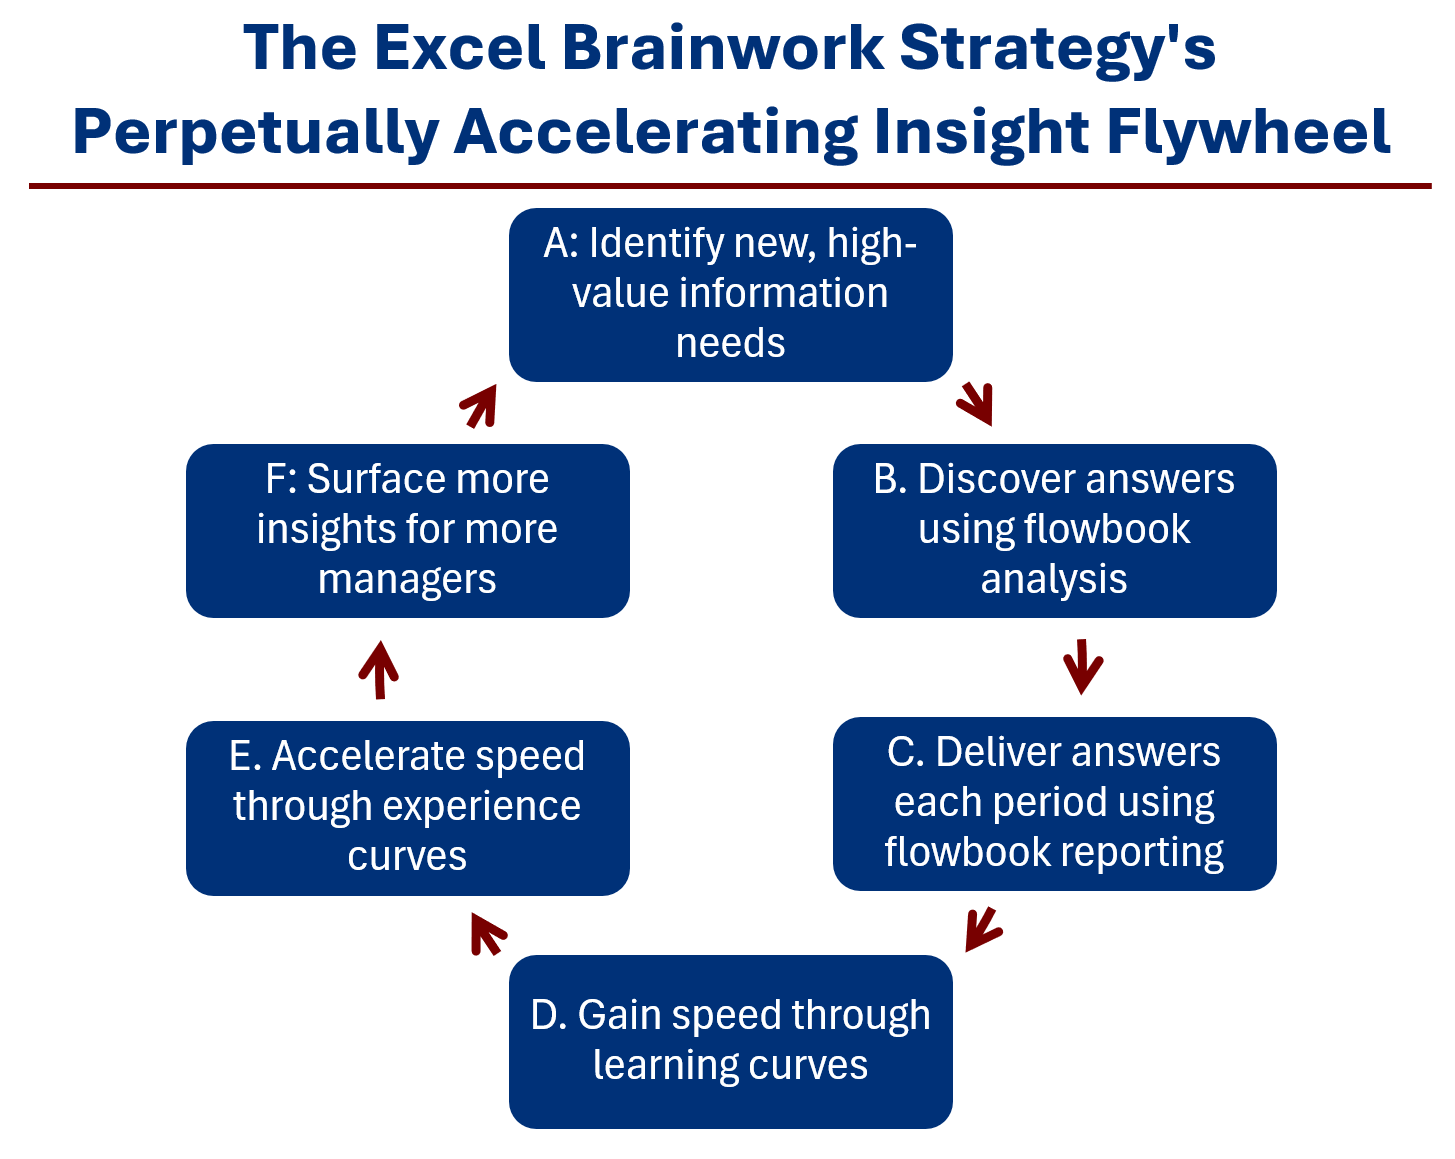
D. Gain speed through learning curves
Excel Data Plumbers grow faster at creating new reflows—at a constant rate—each time they double the number of reflows they create.
E. Accelerate speed through experience curves
Teams of Plumbers share flowbook logic, structure, and enhancements—improving system-wide performance with each doubling of the total number of reflows the teams create.
F. Surface more insights for more managers
Use newly freed-up capacity and growing professional and data knowledge to deliver more custom reflows to more managers, while ending reflows that are no longer useful.
Each cycle through the flywheel creates more insight, more quickly—and with less manual effort. Impact compounds. Innovations grow. More time saved becomes more time invested in answers, solutions, and management action.
The flywheel’s growing momentum feeds the next round of insight—in perpetuity.
The Strategic Payoff
When Excel work is structured, teams get more done with less effort. They spend less time solving the same problems, over and over again—and more time solving new ones. They don’t just get faster, they get smarter. And with the help of AI, they become more innovative.
Because everyone uses the same dataflow strategy, improvements made by one person benefit everyone. The experience curve doesn’t belong to a person. It belongs to the organization.
This creates an information advantage for the organization, which compounds over time.
A Curve Worth Climbing
If Excel still feels like manual labor today, your ad hoc Excel strategy is why. It’s not a matter of talent or tools. It’s a matter of strategy.
Give your team a shared way to work, and they’ll build momentum and game-changing value. Not just on one report or analysis, but across every reflow. That’s what the compounding steps of Excel productivity promise—and what the Insight Flywheel delivers.
Build your own Excel Insight Flywheel—standardize, automate, and compound your team’s impact today. Join the EDP Institute today.
Excel’s Scutwork Strategy has a mind-numbing opportunity cost. Click the link to see how it’s calculated.