How to Use Excel and AI to Tell Powerful Stories About Your Data
With help from AI, the EDP Strategy frees Excel users from drudgework, giving them time to craft data stories that move managers from confusion to clarity.

SUMMARY: Data storytelling transforms raw data into clear, actionable insights. This article explains how Excel users can overcome time constraints and tool limitations by combining an all-Excel strategy with AI and flipbook tools. The result is faster, more engaging, and more insightful reporting that moves stakeholders from confusion to clarity. Here’s an introduction to the new strategy.
Numbers can’t speak for themselves. Without a story, they’re just noise.
But with data storytelling, you can turn your Excel reports into clear, memorable, business-changing narratives—while slashing your company’s costs.
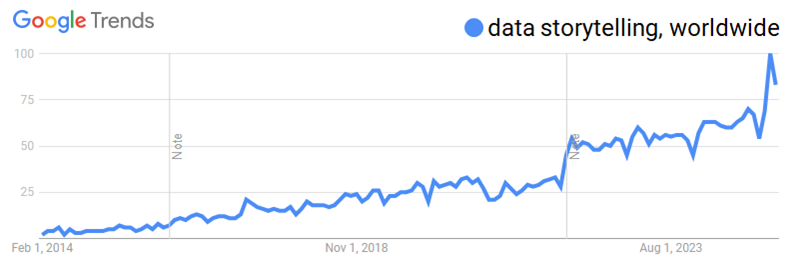
Over the past decade, the world has taken a keen interest in data storytelling, as you can see in this Google Trends chart generated in March 2025:
Professionals in nearly every field now recognize its importance.
That includes finance, marketing, business intelligence, operations, and accounting. The common theme? People need help making sense of complex, high-volume, and diverse data—because insight doesn’t just come from understanding one number, but from connecting many.
And storytelling helps make such data more accessible, memorable, and actionable—much more quickly.
What Is Data Storytelling?
Data storytelling isn’t just about visuals. It’s about meaning. It means taking data and wrapping it in a narrative your audience can follow. A good story explains what happened, why it matters, and what should happen next. It turns abstract numbers into insights your audience will remember—and act on.
“Effectively communicating complex data insights to stakeholders” shows up in more job listings every day. And that’s no surprise. While Excel reports or BI dashboards can present a wall of facts, data storytelling helps people see the story behind those facts. It speeds up understanding. It builds trust. And it creates alignment—across teams, departments, and decisions.
The Problem with Traditional Tools
Here’s the challenge:
Excel wasn’t designed to tell stories. Nor were traditional BI tools. They present data well. But they don’t guide the viewer through a narrative. Most reports force the audience to hunt for meaning. And too often, the audience gives up.
That’s a big problem. Because if your managers can’t find the story, they’ll miss the insight. And your hard work will go to waste.
You can tell a great story in Excel. But it takes time. You have to clean your data. Then build clear visuals. Then structure a presentation to guide your audience through the key points. And once you’re done, you still have to present it. Which usually means a meeting. And most meetings are where good insights go to die.
The Meeting Bottleneck and a Better Way Forward
Meetings are slow. They’re often disorganized. And they’re rarely searchable after the fact. They don’t scale well. They don’t preserve your insights. And they don’t always reach the right people at the right time.
So even if your analysis is excellent, your impact is limited. Because you’re stuck inside the meeting model.
There’s a better way. Over the past few years, Simplebooklet—a unique flipbook-style SaaS tool—has emerged. It lets you present your Excel results like a high-end digital publication. You can annotate the pages. Add audio or video. Let others comment and respond. It’s like a meeting—but better. It’s asynchronous, searchable, interactive, and short.
From Drudgework to Strategy
But even with a great tool, there’s still the question of time. Learning data stories takes time. And most Excel users are already swamped with repetitive tasks. They’re stuck in Excel drudgework—the constant cycle of updating, reformatting, rechecking, and rebuilding reports. That’s why we need more than a tool. We need a strategy.
The Excel Data Plumbing (EDP) Strategy is the first true strategy for becoming ultra-productive in Excel. Instead of rebuilding the same report every month, you build a flowbook. A flowbook automates your report. It flows data from the source to your final results—with one command. That frees you from drudgework. It gives you time to tell stories.
It also saves your employer thousands of dollars of opportunity costs, per employee, per month.
You can’t tell a story if you don’t know what it is. So first, you have to discover it. And that’s where Excel—and ChatGPT—shine. Together, they help you explore your data in the context of other data—internal and external. Spot patterns. Ask better questions. Find the “why” behind the “what.”
The Role of AI in Finding the Why
The best stories often hide beneath the surface. Maybe it’s a trend that doesn’t follow the usual seasonality. Or a KPI that lags behind others. Or a new risk no one saw coming. Finding those stories requires curiosity, time, and tools. The EDP Strategy gives you all three.
AI can play a key role in this process. ChatGPT, for example, can help you explore your data, clarify your thinking, and surface hidden relationships. More importantly, it can help you explain internal performance in the context of external factors—like economic cycles, competitor behavior, or even public policies. With AI’s help, you can elevate your story beyond the numbers.
Visuals That Make Your Message Stick
Stories help us understand. But visuals help us remember. Excel charts, when designed well, can make insights unforgettable. Especially when those charts are paired with a short narrative that explains the “so what?”
Your message sticks. Long after the meeting—or flipbook—is over.
Data storytelling isn’t fluff. It’s not decoration. It’s the bridge between analysis and action. Without a story, numbers sit in silence. With a story, they speak. They persuade. They move people to act. And that’s the ultimate goal of every report, dashboard, or analysis you build.
In Summary
Data storytelling is more than a buzzword. It’s a core skill for modern Excel users.
But to tell better stories, we need time. And to get time, we need strategy. That’s where the EDP Strategy comes in. Add in a great tool like flipbooks, and you’ve got everything you need to turn raw data into real insight—without wasting hours or drowning in meetings.
And that’s how we move from drudgework to brainwork. From report generator… to data storyteller.
Fine the time to learn your data’s stories—and explain them. To begin, learn about the EDP Institute here.